Archive List for bullish

Hammer and Hanging Man Chart Patterns

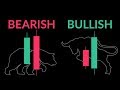
The Hammer and Hanging Man patterns go hand in hand and represent a bullish and bearish signal. In this video trading expert David Jones breaks them down and shows us how to spot them on the chart, how to interpret their appearance and what to watch out for before making a trading decision. At Trading 212 we provide an execution only service. This video should not be construed as investment advice. Investments can fall and rise. Capital at risk. CFDs are higher risk because of leverage.

Dark Cloud Pattern for Beginners

The Dark Cloud is one of the more frequent patterns that can be found in charts. Trading expert David Jones deciphers its structure and meaning for us in this detailed video and shows it in real chart examples. Unlike the Engulfing Candlestick pattern this combination of consecutive candlesticks is found a bit more often and are considered more unreliable. Traders look for these formations as confirmations of larger trends, especially if they are around price levels already identified as support or resistances. David demonstrates the theory behind this pattern and showcases it in real chart examples that also have different levels of success. Its equivalent pattern, perceived as a bullish […]

Bitcoin Dropping: Opportunity or Disaster?

The last week has seen one of the most serious drops for Bitcoin ever since the flagship cryptocurrency entered the mainstream. Several support levels were broken withing days of each other and right now it’s trading at 7703 after bouncing up from yesterday’s low at 5970. A lot of news has been accompanying this selloff – the largest U.S. banks banned cryptocurrency purchases with their credit cards, the UK imposed the same barrier at almost the same time. More regulation does seem to be on its way in the western economies but at the same time governments in Singapore and Australia have shown no signs of any unease with the […]

Candlestick Engulfing Pattern Tutorial

Japanese candlesticks have one ability that most other chart types don’t – they can show so called “engulfing” patterns. An engulfing pattern is defined as when the open and close price of a bullish or bearish candle are within the range of the open and close price of the candle following them. When this happens many traders believe it is a sign that a trend has just finished and this is the best possible entry point. That’s the theory but as we know the market doesn’t always answer to predefined rules. That’s why David Jones includes real examples alongside the theory behind these specific chart patterns. You’ll also see different […]

Bitcoin Edging Towards a Breakout

0 It’s been another week of ups and downs for Bitcoin but overall the larger bearish trend has continued. No new highs have been registered and there is a support level that has had a couple of tests and could be seen again if the downward momentum continues. That support lies at 9150, which was touched on the 17th of January. If selling continues and it’s broken, then a further down move to 8400 could also materialise. Trading expert David Jones also discusses the latest news from South Korea where authorities have clarified their requirements for trading bitcoin and cryptocurrencies in general. They won’t be banning it altogether but rather […]

Bid / Ask Spread | Trading Terms

0 The difference between the buy and sell price (also known as bid and ask) is one of those things that mystifies newbies. We’re not used to having two prices for the same thing when we go to a store or shop online. This video explains in detail what they mean and why it’s there in the first place. As there are many connected things stemming from the bid/ask price David covers them as well, to provide a more holistic description of the term. The exact terminology, its place on a chart, how to interpret it is discussed in a simple and easy to grasp way before continuing to a […]

Short Selling | Trading Terms

Selling with the goal of profiting, also known as shorting, is one of those things that many new traders are baffled by. How can I sell something that I don’t own? How can I win if something appears to be losing? This video answers those questions and more. From the definition of the term, to what it looks like in the Trading 212 platform, we look into this term in a simple way that will make it as simple as possible to understand. David goes through the theory and demonstrates it in the real market with a step by step guide on how to find situations when a short could […]

Trading Strategy with Support & Resistance: Where to Buy / Sell and Set Stops

Support and resistance trading seems simple enough but therein lies the greatest risk – complacency. That reason many traders make mistakes either with where they buy and sell, where they set their Stop Loss and Take Profit. Fortunately we have David Jones who will guide us in this endeavour for beating the markets. Test and practice your strategies in real market conditions with virtual money. Learn to trade and invest for free. – https://www.trading212.com/en/Practice-for-Free-GBP Download the free native mobile apps now: Trading 212 for iOS – https://itunes.apple.com/gb/app/trading-212/id566325832?mt=8 Trading 212 for Android – https://play.google.com/store/apps/details?id=com.avuscapital.trading212&hl=en-uk Subscribe | Select the Alarm Bell | Hit the Thumbs Up | Share | Comment At Trading […]