Archive List for trading

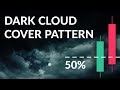
Dark Cloud Pattern for Beginners

The Dark Cloud is one of the more frequent patterns that can be found in charts. Trading expert David Jones deciphers its structure and meaning for us in this detailed video and shows it in real chart examples. Unlike the Engulfing Candlestick pattern this combination of consecutive candlesticks is found a bit more often and are considered more unreliable. Traders look for these formations as confirmations of larger trends, especially if they are around price levels already identified as support or resistances. David demonstrates the theory behind this pattern and showcases it in real chart examples that also have different levels of success. Its equivalent pattern, perceived as a bullish […]

Candlestick Engulfing Pattern Tutorial

Japanese candlesticks have one ability that most other chart types don’t – they can show so called “engulfing” patterns. An engulfing pattern is defined as when the open and close price of a bullish or bearish candle are within the range of the open and close price of the candle following them. When this happens many traders believe it is a sign that a trend has just finished and this is the best possible entry point. That’s the theory but as we know the market doesn’t always answer to predefined rules. That’s why David Jones includes real examples alongside the theory behind these specific chart patterns. You’ll also see different […]

What is a Pip or Point | Trading Terms

It might seem logical what a point or pip is in trading but some traders, especially new ones can get confused about the meaning of the term. This video sheds light on the exact definition of the terminology and what it represents. Different examples of currencies with two, four and five digits after the decimal are included so that you can see what represents a pip. Stocks are also discussed and presented, as they make up a sizeable portion of the trading world. Real examples on the chart are also shown, so that you can place them in context and see how they are used when talking about trades, targets […]

Slow Stochastic for New Traders

The Slow Stochastic isn’t necessarily among the top three of most popular indicators but it does have a large and loyal following. Our trading expert David Jones takes a look at the math behind it, ways to adjust its parameters and different tricks and tips on how to get the best out of it. It’s one of those indicators that “smooth the edges” – they need a bit more to provide a buy or sell signal. The parameters that build it are designed not to react to sharp moves in both directions (which are often followed by pullbacks) and looks at a broader picture to come into an oversold or […]

Trading Strategy with Support & Resistance: Where to Buy / Sell and Set Stops

Support and resistance trading seems simple enough but therein lies the greatest risk – complacency. That reason many traders make mistakes either with where they buy and sell, where they set their Stop Loss and Take Profit. Fortunately we have David Jones who will guide us in this endeavour for beating the markets. Test and practice your strategies in real market conditions with virtual money. Learn to trade and invest for free. – https://www.trading212.com/en/Practice-for-Free-GBP Download the free native mobile apps now: Trading 212 for iOS – https://itunes.apple.com/gb/app/trading-212/id566325832?mt=8 Trading 212 for Android – https://play.google.com/store/apps/details?id=com.avuscapital.trading212&hl=en-uk Subscribe | Select the Alarm Bell | Hit the Thumbs Up | Share | Comment At Trading […]

How to Trade Trend Reversals

Trend reversals are the holy grail of trading. They are the coveted tops and bottoms that represent the ideal entry points for opening new positions and closing existing ones. So here we discuss how to identify them and what risks there are when you try to “time the market” as experienced traders say. Whether you use indicators, fundamentals or news it’s always a challenging task to find that exact point in time when a price has reached its highest or lowest point for a certain period. This is especially true for short-term trades that happen on the minute timeframes. The perception is that there is more randomness and noise that […]